So hard to tell. Based on the point-in-time count (one of several measurements) compared to 5 years ago family homelessness is down by 37%, singles and chronic homelessness are about the same, and veterans increased by 4 persons.
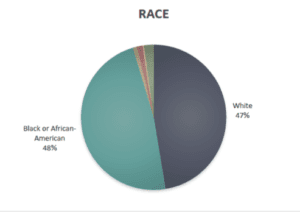
Here’s the full report. One notable aspect is that there were more black people who are homeless than there are white people who are homeless according to this count. Another shameful Dane County disparity to add to the list.
I. BACKGROUND
The Point-in-Time Count of Homelessness (PIT) provides a snapshot of people who are experiencing homelessness on a given night in a community. The Homeless Services Consortium of Dane County (HSC) conducts a PIT twice a year, on the fourth Wednesday of January and July. This year’s July PIT was on the night of July 24, 2019.
The PIT has two components:
- Sheltered counts collect information on people who are sleeping in emergency shelters and transitional housing programs. Most of the information is gathered from the Homeless Management Information System (HMIS) used by nearly all homeless services agencies in Dane County. Community partners that do not use HMIS submit comparable reports to the CoC. The following shelters and transitional housing programs were included in the count:
- Emergency Shelters: The Salvation Army of Dane County Family Shelter, Single Women Shelter, and Medical Voucher Program; YWCA Madison Family Shelter; Porchlight Men’sDrop-In Shelter; and Domestic Abuse Intervention Services Emergency Shelter and Motel Voucher Program
- Transitional Housing Programs: Briarpatch Transitional Living Program; The Road Home Dane County Second Chance Apartment; YWCA Madison Empower Home; Porchlight Spring Street Veterans Transitional Housing; and The Salvation Army of Dane County Holly House*
- Unsheltered counts capture information on people who are sleeping outside, in a vehicle, in a tent, or other places not suitable for human habitation. Teams of volunteers go to “known locations” identified by outreach workers, police officers, parks staff, and other service providers on the night of PIT and conduct surveys. Additional post-counts are conducted at strategic locations following the PIT. This year, 49 staff and volunteers from HSC participated in the unsheltered and post counts. The weather was mild for the unsheltered count: high of 85, low of 60, and around 70 degrees during the main part of the count (10pm-2am).
This enumeration is one of several ways to understand the levels and trends of homelessness in our community. Since the PIT is a snapshot of homelessness for one night, many more people experiencing homelessness over the course of a year are not counted in the PIT. A separate report, Longitudinal
System Analysis (formerly Annual Homeless Assessment Report), captures the unduplicated number ofpeople served in the homeless services agencies using HMIS throughout the year. The community’sCoordinated Entry Housing Priority Lists identify the number of people who report being homeless and in need of housing.
It is important to note that this count excludes individuals and families who are “doubled up” withfriends or other families in private homes or living in hotels or motels. While the U.S. Department ofEducation’s definition of homelessness includes children who are living in such arrangements, thesefamilies are not included in the PIT, per HUD requirement. Individuals in institutions are also not included.
This report was prepared by the City of Madison Community Development Division on behalf of Homeless Services Consortium of Dane County. Questions about the report can be directed to Sarah Lim, Community Development Specialist, at slim@cityofmadison.com.
II. KEY FINDINGS
On a Single Night in July 2019
650 people experiencing homelessness were identified in Madison/Dane County on the night of the 2019 July PIT.
- 34 percent or 221 persons were in households with children (families), representing 60 families.
- 65 percent or 424 persons were in households without children (individuals).
- 22 percent or 140 persons were children under age 18.
- Nine percent or 61 persons were young adults age 18-24. 26 were parenting youth.
- 22 percent or 142 persons were considered chronically homeless†.
- Seven percent or 44 persons were veterans.
- 37 percent or 238 persons stayed in unsheltered locations such as on the street, in vehicles, in tents, or other places not suitable for human habitation.
Black or African Americans are considerably overrepresented among the homeless population compared to the overall Dane County population. While accounting for six percent of the Dane County population, African Americans accounted for 48 percent of all people identified as experiencing homelessness.
† Chronically Homeless Individual refers to an individual with a disability who has been continuously homeless for one year or more or has experienced at least four episodes of homelessness in the last three years where the combined length of time homeless in those occasions is at least 12 months. Chronically Homeless People in Families refers to people in families in which the head of household has a disability and has either been continuously homeless for one year or more or has experienced at least four episodes of homelessness in the last three years where the combined length of time homeless in those occasions is at least 12 months.
Since 2018
There was no significant change in the total number of persons experiencing homelessness from the previous year, 640 persons to 650 persons.
- The number of persons in households without children (individuals) decreased by 6 percent or 26 persons.
- The number of persons in families increased by 18 percent or 34 persons. The number of families increased from 54 families to 60 families.
- The number of people experiencing chronic homelessness increased by 17 percent or 21 persons.
- The number of veterans experiencing homelessness slightly decreased by 5 persons.
- Excluding transitional housing programs, the number of persons experiencing homelessness either at emergency shelters or unsheltered locations increased by three percent or 17 persons, from 527 in 2018 to 544 in 2019.
Since 2014
Overall homelessness was down by 18 percent or 142 persons from five years ago.
- The number of individuals was approximately the same, 422 in 2014 and 424 in 2019.
- The number of persons in families was down by 37 percent or 132 persons, 353 in 2014 and 221 in 2019.
- The number of people experiencing chronic homelessness was approximately the same, 139 in 2014 and 142 in 2019.
- The number of veterans experiencing homelessness was up by 4 persons.
More info
There are additional charts and pictures in the full report, you may want to take a look!
PRIORITY LISTS
Another way to look at if we are ending homelessness is by looking at the numbers of people who we have identified in our community as being homeless and in need of housing.
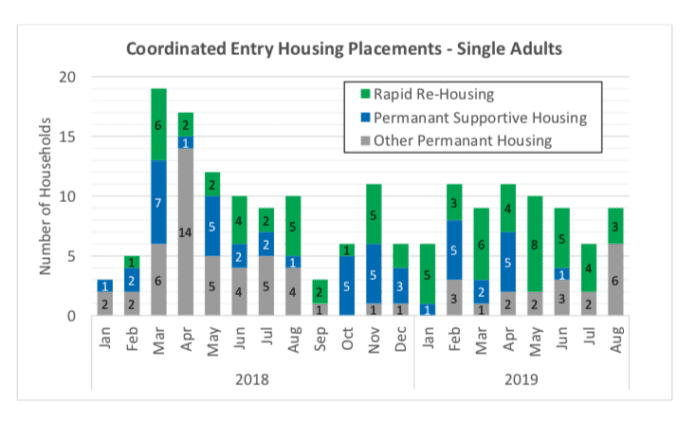
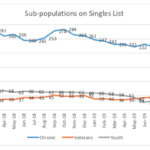
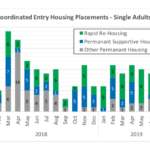
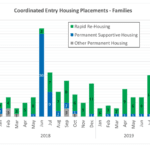
These numbers are complicated because they are only as good as the information collected and the accuracy of it being updated. The drop in single numbers above is because there was a major list clean up, not because people actually got housed. The actual people counted has stayed the same. The charts below show how many people are getting housed (that we know of) and again, look at the charts closely they have a different scale so they might be misleading. Basically we are lucky if more than 10 singles or more than 10 families get housed in one month.
If you want more and updated information, you can always check out the Homeless Services Consortium Website.

