After all the bad news and hand wringing and calls for more federal support, looks like the 2nd quarter projections have the city $2.4M in the clear.
2ND QUARTER PROJECTIONS
Here’s the memo. I’d like to see an analysis of how much of the deficits were caused by the mayor’s emergency orders. Also, its just gross that Community Development Division – the division that should be running a deficit to aid people struggling in our community, actually has a surplus – while almost every other department has a deficit. Meanwhile, the police department, of course, has one of the largest deficits.
The bottom line:
As of the close of the 2nd Quarter, the General & Library Funds are projecting an $11.1 million deficit, an overall decrease of $770k from the 1st Quarter. The projected deficit does not account for the funding from the following sources: CARES Act, FEMA, or Routes to Recovery. These sources are projected to have a $13.5 million positive net impact on the 2020 General Fund budget (in other words, these sources will reduce the projected deficit).
The All Funds projected deficit has decreased by $7.5m between the 1st and 2nd Quarters. The overall improved outlook is driven by expenditure reductions implemented by the Room Tax Commission along with improved outlooks for the Water, Sewer, and Stormwater utilities.
*During the fall a series of 2020 budget amendments will be introduced to reflect receipt of CARES Act funding, Wisconsin Route to Recovery, and FEMA funds.
**The Administrative Actions issued in May remain in place in an effort to continue controlling spending. Agency purchasing and hiring requests continue to be reviewed by the Mayor’s Office on a weekly basis.
No Changes
-
State Aid: No Projected Change – The projection assumes revenue from all State Aid programs will be realized at the budgeted level.
Departments or revenue sources with deficits
Revenues
-
Licenses & Permits: $1.4m Deficit ($140k change from 1st Quarter) – Monthly revenue for Building Permits has been, on average, 90% of the monthly trend from prior years. The projection assumes revenue in the second half of the year will be 80% of the prior year trends.
-
Fines & Forfeitures: $3.6m Deficit ($1.7m change from 1st Quarter)
- Uniform and moving violations are projected to have a $160k deficit. Monthly revenue from February to April exceeded prior year trends; however, no revenue has been recorded since May. The projection assumes revenues in the second half of the year will return to 75% of prior trends.
- Parking Violations are projecting a $3.2m deficit. Monthly revenue from parking citations declined to a range between 2-20% of prior trends during the height of the Stay at Home orders. The projection assumes monthly revenues will be 10% of prior year trends for the remainder of the year.
- Investments & Interest: $2.2m Deficit ($450k change from 1st Quarter) – The projection is based on investment yields and cash balances through the 2nd quarter. Investment yields have fallen from 1.59% in January 2020 to 0.324% in June 2020. Investment yields are expected to remain below 2019 levels through the remainder of 2020 and through 2021.
- Misc Revenue & Other Financing Sources: $37k Deficit (No change from 1st Quarter – Easements & Encroachments: Based on trends from 2017-2019, the majority of Encroachment revenue is realized in the January, February, and December. While revenue from this source has trended down in May and June, all other months in 2020 have been consistent with prior years. The 2nd Quarter projection assumes continued declines from July-November with December revenues in line with prior years.
- Transfers from Other Sources: $3.1m Deficit ($170k change from 1st Quarter) – The projection reflects reduced Room Tax revenue consistent with the reductions adopted by the Room Tax Commission.
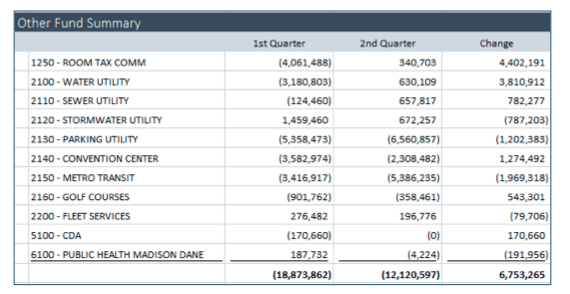
- Enterprise funds – The projected gap within the City’s enterprise funds decreased by $6.7 million from the 1st to 2nd Quarters. The changes are outlined below:
Departments/Expenditures
- Clerk’s Office: Projection=$1.4m Deficit ($1.3m increase from 1st Quarter) – The projected deficit is driven by projected costs of administering elections during the COVID pandemic. The final cost of the April election was $640k, compared to $500k assumed in the 1st Quarter projection.
-
- The August and November elections are projected to cost $1.0 million per election, or $2.0m total. The 2020 Adopted Budget included $1.1m to administer both elections. There is potential the November election will cost more to administer than August election, but specific cost breakdowns are not currently available.
- The Clerk’s Office was recently awarded two grants totaling $1.4m that will be used to offset the projected deficit.
- Fire Department: Projection=$1.0m Deficit ($1.1m decrease from the 1st Quarter) – Revenue is projected $178,000 lower than 1st quarter.
- Fire Permits are lower due to year-to-date trends ($37,000). Permits are related to building and the general state of the economy.
- Special Duty and Reimbursement of Expense are projected lower ($107,000) based on the reduction in anticipated events. At the time of the 1st Quarter projection, the impact of the virus on summer events was not known. The 2nd Quarter projection reflects these events being cancelled and no additional events anticipated for the remainder of 2020.
Expenses are projected $1,270,000 lower than first quarter.
-
- Permanent Salaries are projected $393,000 less than 1st Quarter due to additional vacancies and the elimination of the recruit class.
- Overtime has been reduced ($295,000) largely due to fewer events and a reduction in overtime for elevator inspections. The 1st Quarter projection anticipated a need for overtime to complete the backlog of inspections that built up during the early stages of the shut-down. The department now anticipates completing all inspections without significant overtime. Benefits are correspondingly lower ($163,000).
- Supplies and Services are $419,000 lower than the 1st quarter projection due to the purchasing freeze, more data than the first quarter, and no recruit class. The largest savings are in building improvements (purchasing freeze), travel (COVID), and savings related to the cancellation of the recruit class (uniforms, MATC training, and medical services).
- Police Department: $2.4m Deficit ($1.1m increase since 1st Quarter)
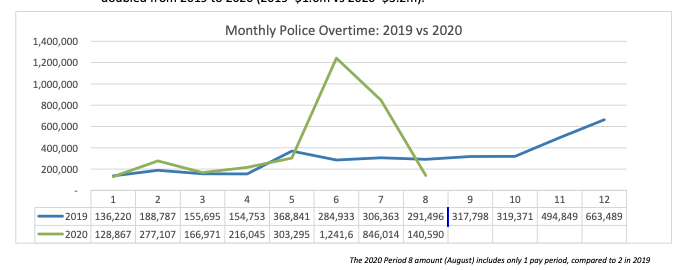
- The increase in the projected deficit is primarily driven by costs associated with the unrest that began in 2nd Quarter. Through the end of the 2nd Quarter, the Department has incurred $1.5 million in overtime and mutual aid costs associated with the response. The 2nd projection assumed MPD will continue to see significant but declining protest activity through the 1st week in August, this projection is consistent with actuals through the end of July. The chart below shows monthly overtime in 2020 compared to 2019. As demonstrated in the chart, 2020 monthly overtime trends were generally consistent with 2019 before spiking in June. Overtime earned through the first half of the year has doubled from 2019 to 2020 (2019=$1.6m vs 2020=$3.2m).

- Streets Division: $263k Deficit ($620k increase since 1st Quarter)
- At the 1st Quarter the Streets Division was projecting an overall surplus, based on 2nd Quarter assumptions the Division will have a $620k deficit in 2020. The change is driven by updated assumptions pertaining to how staff time is being allocated across the General, Stormwater, and Urban Forestry funds.
- The 1st Quarter projection assumed Streets would reach full staffing during the summer months (fill 6 vacant positions) and filling all hourly positions. The Streets Division is currently holding 9 permanent positions vacant and has filled 4 of 17 hourly positions.
- The 2nd Quarter projection continues the assumption for three additional general plow events in the 4th Quarter. In 2019 there was one general plow event during the 4th Quarter. The projection assumes an additional salt purchase will also be made in the 4th Quarter, there is potential that purchase can be deferred to 2021.
-
Parks: $130k Deficit ($695k decrease from 1st Quarter)
- The 1st Quarter projection assumed a $623k loss in charge for service revenue. Based on 2nd Quarter assumptions, this revenue loss has increased to $790k primarily resulting from a high number of event cancellations.
- Lost revenue is partially offset by additional salary savings. Savings from personnel costs increased from $100k in the 1st Quarter to $890k in the 2nd Quarter. The major change can be attributed to the use of redeployed staff reducing the need for hourly employees (total hourly savings=$380k).
- Parking Utility: $6.5m Deficit ($1.2m Increase from 1st Quarter)
- Projected revenue losses resulting from COVID increased by $1.0m from a projected $7.2m loss in the 1st Quarter to an $8.2m projected loss in the 2nd Quarter. The 1st Quarter projection assumed monthly revenue would return to 30% of prior trends in the summer months, based on actual data monthly revenue has only rebounded to 17%. The projection assumes revenues will remain under 50% of prior trends through the remainder of 2020.
- The Parking Utility currently has 28 employees on a workshare program that is scheduled to end on September 1st.
- Convention Center (Monona Terrace): $2.3m Deficit ($1.3m Increase from 1st Quarter)
- 2nd Quarter projections include the 50% reduction adopted by the Room Tax Commission in June. A portion of Monona Terrace’s Room Tax reduction ($795k) will be implemented by reducing funding for 2020 capital expenditures.
- The 2nd Quarter projection assumes a September opening date (pushed back from August in the 1st Quarter projection). There are currently 75 paying events booked through the remainder of 2020.
- Monona Terrace currently has 15 employees (out of 54.75) that are on a workshare program for at least one day/week. The projection assumes these employees will remain on workshare through early December.
- Metro: $5.4m Deficit ($1.9m Increase from 1st Quarter) – ***We got $24.5M for transit revenue losses from the CARES Act.***
- The most significant change from Q1 projections is lower estimates for charge revenues. In Q1, farebox revenue estimates were assumed to return to 2019 levels by July. Actuals from Q2 and temporary fare-free service now drive lower estimates for revenue. While Q1 estimated $9.3m in charge revenues, Q2 estimates $6.4m.
- This projection does not include the use of CARES Act funding in 2020.
Departments or revenue sources with surpluses
Revenues
-
Charges for Service: $190k Surplus ($1.4m change from 1st Quarter) – The 1st Quarter projection assumed sharp declines in revenue from Ambulance Conveyance fees. Through the first half of the year monthly revenue from this source has exceeded the prior year trends (2017-2019). Based on 2nd Quarter assumptions, Ambulance Conveyance fees will generate a $500k surplus in 2020.
Departments/Expenditures
- Library: $1.2m Surplus ($860k increase from 1st Quarter)
- The 1st Quarter projection assumed the Libraries would reopen at some point in the 2nd Quarter. This assumption has been updated to reflect the Libraries remaining essentially closed, except for curbside pick-ups and computing appointments, for the rest of the year. This has resulted in a reduction in expenses of $800,000 from the 1st Quarter.
- While printing service revenue and revenue from fines are projected under budget $280,000, the MPLF (Library Foundation) has committed to additional donations of approximately the same amount, leaving the overall projection for revenue essentially consistent with the 1st quarter.
- Personnel savings increased by $800,000 driven by holding 10.6 positions vacant and savings on hourly staffing.
- Community Development Division: $56k Surplus ($260k decrease from 1st Quarter)
- CDD’s overall projected surplus decreased due to assumptions in Community Agency Contracts. The 2nd Quarter projection assumes the full budgeted amount for these contracts will be spent.
- In both the 1st and 2nd Quarters, Childcare Tuition Assistance was projected to have a $100k surplus. Changes and/or expansion of this program will reduce CDD’s overall projected surplus likely resulting in an overall agency deficit.
- Room Tax: $340k Surplus ($4.4m Increase from 1st Quarter)
- The Room Tax Commission recently adopted what equated to 50% of expenditure reductions. The 1st Quarter projection did not reflect any expenditure reductions.
-
Water Utility: $630k Surplus ($3.8m Increase from 1st Quarter)
- During the 2nd Quarter the Water Utility received approval to begin implementing a 9% rate increase. The rate increase took effect in first week of August, the 2nd Quarter projection assumes a 6% increase for August and 8.9% increase for the remainder of 2020. The 1st Quarter did not include an assumption for increased revenue from rates.
- In addition to the rate case, the Water Utility has also implemented a series of cost controls to reduce overall spending, including holding positions vacant and deferring non- essential spending.
NO LAYOFFS IN 2020
It sucks that we have a surplus and people are on workshare, hour reductions and unpaid leave. I wonder how much we are actually saving with those measures in limited departments? Especially because its not the high paid workers that are helping the city, its the lowest paid workers.
Dear Colleagues,
On August 10, the Finance Committee will hear a presentation highlighting the first half of our 2020 budget, and projections for the rest of the year.
I know that job security and the possibility of furloughs have been on the minds of many employees. I understand that this has been a very stressful time for many employees both personally and professionally. I speak with Human Resources and check in with your unions and professional associations frequently to hear about concerns and issues on the mind of employees. I met with them this morning and want to share with you what I shared with them.
At the Finance Committee meeting Monday, I intend to announce that, barring any sort of dramatic change in the budget in the second half of the year, we do not expect broad-based furloughs of employees in 2020. Workshare programs in certain agencies will continue due to severely reduced program revenues. While 2020 is looking a bit better, we are still working to resolve a significant budget deficit in 2021, and I want to be clear that this announcement is not a statement about what we might need to do in 2021.
We’ve been able to reduce our budget gap through a combination of federal funds from the CARES Act, including $24.5 million to replace transit revenue losses and $4.1 million from the State of Wisconsin’s CARES Act funding, as well as reduced spending, limited hiring, and reduced costs of operation in many departments. Employees have also contributed to this gap, through use of workshare, hours reductions, and unpaid leave. I am very grateful to these employees and their departments which were adversely impacted from the pandemic.
Employee innovations and flexibility have helped us weather this pandemic so far while continuing to provide as many essential City services as possible. I am grateful for your hard work, your creativity, your dedication to service and your kindness to others, during these extraordinarily difficult times. Thank you.
We will get through this together.
Sincerely,
Mayor Satya


