Well 9 is one of the 3 wells that has the highest levels of PFAS in it according to the most recent well testing, but it is unlikely to be shut down like well 15. Here’s why.
Here’s the video of the presentation hosted by Alder Grant Foster with the City of Madison Water Utility and Madison and Dane County Public Health Department. The first 40 minutes is the presentation, the last 40 minutes is the Q&A with the audience. (Transcript below)
Note on Errors:
My faith in the accuracy of the information here is a bit shaken. I’m not an expert in this area, but there were clearly 2 different errors made in the presentation. At one point someone asked how many ounces were in a “meal” of fish. The public health department first said 8 ounces, then looked it up and told the audience it was 4 ounces. The other was they said there was a voluntary ban on PFOS and PFOAs in the 1990s – one of the audience members was making a goofy face so I looked it up and google tells me “PFOS and PFOA are stable chemicals that are comprised of chains of eight carbons. … By 2002, the primary U.S. manufacturer of PFOS voluntarily phased out production of PFOS. In 2006, eight major companies in the PFASs industry voluntarily agreed to phase out production of PFOA and PFOA-related chemicals by 2015.” Both of these statements came from Jeff from the Public Health Department who was not one of the main speakers but is the epidemiologist for Dane County.
If you spot other errors, please feel free to send them to forwardlookout@gmail.com or make a comment below.
HANDOUT AT THE MEETING
The handout at the beginning of the meeting was never referred to in the presentation, but here is what it said.
Information about perfluoroalkyl and polyfluoroalkyl substances (PFAS)
PFAS compounds are not regulate on the federal or state level although Wisconisn is working toward developing drinking water standards. No water utilities in Wisconsin are currently required to test fo any PFAS compounds in drinking water. No food packaging or consumer produces are required to label or disclose the presence of PFAS.
What are PFAS?
PFAS are a large group of man-made chemicals that are used in many products like non-stick pots and pans, water resistant and stain resistant clothes, food packaging, upholstery, carpets, and firefighting foams. Manufactured by the chemical companies in the 1940s, PFAS molecules are made of of a chain of carbon and fluorine atoms linked together – one of the strongest chemical bonds in existence. There are no known natural processes that break down these chemicals.
How much PFAS has been detected in Well 9?
In 2019, Madison Water Utility tested Well 9 for 30 different PFAS compounds. Nine types of PFAS were detected with a total concentration of just under 52 parts per trillion. About 80% of the that total comes from one compound called PFBA. There is no Federal or Wisconsin guideline for PFBA in drinking water. THe only U.S. guideline we do have comes from Minnesota’s Department of Health, which has a recommended standard for PFBA of 7,000 parts per trillion. The amount of PFBA in Well 9 is 42 parts per trillion. Denmark and Sweden also have drinking water recommendations for PFBA of 100 ppt and 90 ppt respectively.
Is my water safe to drink?
Every well currently operating in Madison meets every PFAS standard set by any state in the U.W., including New Hampshire and Vermont, which have the toughest standards. Madison Water Utility looks to the Department of Natural Resources (which oversees our testing and enforces the Safe Drinking Water Act), the Wisconsin Department of Health Services, and Public Health Madison Dane county for guidance about the safety of the city’s drinking water.
What are the health impacts of high levels of PFAS chemicals?
Scientists are still learning aobut eh health effects that various PFAS can have on the body. The more widely-used compounds, like PFOA, PFOS, perfluorohexane sulfonic acid (PFHxS) and perfluorononanoic acid (PFNA), have been studied more than other PFAS. Some, but not all, studies in humans with PFAS exposure have shown that high levels of certain PFAS may affect growth, learning and behavior of infants and older children, lower a person’s chance of getting pregnant, interfere with the body’s natural hormones, increase cholesterol levels, affect the immune system, increase the risk of cancer.
Can Madison Water Utility add a treatment facility to Well 9?
Our testing does not show a need for water treatment at Well 9. It’s unclear what treatment, if any, is effective at removing PFBA at the levels found at Well 9. Current PFAS treatment technology is effective at removing high levels of other compounds, like PFOA and PFOS.
Can I use a filter to remove PFAS from my drinking water?
Some PFAS chemicals can be removed by activated carbon and reverse osmosis. Filters that are certified to remove PFAS are certified to bring concentrations of two types – PFOA and PFOS – down to levels below EPA Health Advisory Level of 70 ppt. No filters are currently certified to remove other types of PFAS or remove very low or trace amounts of the compounds.
More questions? We are always happy to answer.
Email: water@madisonwater.org
Madison Water Utility Water Quality line: 608-266-4654
Find out which well serves your address and view PFAS testing results on our website: Madisonwater.org/pfas
WELCOME/INTRODUCTIONS
Alder Grant Foster, District 15 introduces people in the audience. Dane County Supervisor Kristen Audet and Water Utilty Board Chair Gene McLinn and Amy Barrilleaux Public Information Officer with the Water Utility she’s a great resource going forward for anybody that has questions she’s always available to talk with folks and then the people who will be giving the heart of the presentation
Joe Grande who is the Water Quality Manager for the Water Utility. He’s going to give a lot of information about the water utility water quality and specifically around PFAS. From Public Health Dane County Madison we have Doug Voegeli, Director of Environmental Health and also Jeffrey Lafferty who is the Public Health Epidemiologist. So these are two folks that know a lot about PFAS, both in terms of any potential adverse effects in drinking water but also surface water and kind of more more broadly.
The goal is basically to have a 20 to 30 minute presentation that kind of just goes over what is PFAS? what do we know about it? what don’t we know? Looking specifically in terms of in the water again, what do we know? what don’t we know? Specifically related to Madison area including well 9 since that kind of came into the news recently and then we’ll have some information again on surface waters, so Starkweather Creek, the updated fish advisory, some information around that and then we should have plenty of time for questions from folks. So really the goal for tonight is to share information, answer as many questions as possible, and just really really provide information here tonight.
So, be present, you know obviously I think every knows how to do this. If you get a call, please take it out of the room. Share the air. You might have a whole long list of questions, make sure you are letting other people get their questions in. If it’s already been asked you probably don’t need to ask it again. Respect individual perspectives and contributions to the discussion.
At the end, after the presentation, we’ll have a question and answer session. So raise your hand, I’m gonna try and jot down the order that I’m seeing people. Try to keep it concise, ask your questions and I want to make sure everybody’s going to get the chance to be heard. Don’t interrupt, obviously, yep I’m going to try and make sure everybody has a chance to speak. Then you may be left with additional questions following tonight and we’ve got Amy handing out some informational sheets, there’s a lot of online information as well and I’m sure staff here is happy to answer individual questions later or is available to do some follow-up too if there are specific questions that for some reason can’t the answer tonight.
WATER UTILITY PRESENTATION
Joe Grande with the Madison Water Utility, Water Quality Manager. He’s been in this position for about a dozen years and have been have deeply involved with the PFAS issue since we started testing for PFAS starting in 2012. My goals tonight are really to try to provide some background on what PFAS are, what our monitor has been to date, what are some of the things that we can do about PFAS and then essentially try to answer your questions. Folks from public health will be addressing any of the questions related to health aspects of PFAS.
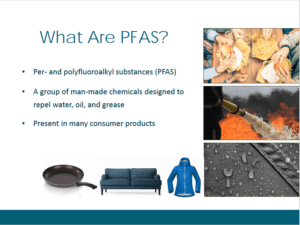
So PFAS has a lot of different names that people talk about. The two most common ones PFOA and PFOS. What are they? They are per- and polyfluoroalkyl substances. That’s what the PFAS stands for and what exactly they are is a group of chemically similar compounds that are designed to repel water, oil and grease. They have a shared chemistry in that they have a carbon skeleton and they have many carbon-fluorine bonds. A carbon fluorine bond is very unusual for its strength, it’s a very strong bond and once it’s formed it’s very difficult to break down. So these PFAS compounds are virtually indestructible and they generally don’t break down in the environment and so they pretty much just are moving around in the environment. PFAS fast compounds are present in many many different types of consumer products. It’s in food packaging, it’s in nonstick cookware, it’s in water repellent clothing, it’s in stain resistant carpets, furniture those kind of fabrics. It’s virtually in many consumer products that we all are exposed to on a daily basis.
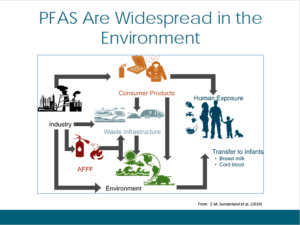
I was asked to show this graphic to kind of demonstrate kind of how PFAS moved through the environment. We can start in the upper left hand corner, here where basically the PFAS start from. These are not natural compounds, these are things every single one of these is a man-made compound. It starts with the industrial manufacturer formerly 3M, Dow, DuPont, Chemours, these are the major manufacturers of these these chemicals. Initially produced back in the 1940s. These compounds are incorporated into our consumer products and then we are in contact with these consumer products whether that’s fast-food wrappers, popcorn bags, food packaging or those those thin coatings that you see on your takeout containers, those are places where you might find PFAS. So those end up sometimes in our food or they end up in our household dust and those materials end up in our bodies. That’s one pathway where it can get into our into our bodies. Another is once you take those consumer products when we’re done using them, we throw them out they go to the landfill. As we know materials that end up in the landfill, landfills are leaky they leach those materials and then these compounds or these PFAS end up potentially contaminating groundwater. And for us groundwater is a source of drinking water. Also the industrial manufacturers, whether it’s the primary manufacturer or the other companies that use those as part of their process or incorporate into their commercial products. Those compounds as they leave the plant or they leave the factory, the wastewater for example, ends up going to a wastewater plant. The wastewater plant is not effective at removing these PFAS compounds and either they’re going to be bound in the the bio solids or the solids that get removed from that from that wastewater or it’s going to be discharged at the back end of the treatment plant and then it’s going to go down to a downstream neighbor. What this is all showing is that we’re now introducing these contaminants into the environment where we may be exposed to them. And those bio solids often are applied to agricultural lands onto foods that we may eat or that may be fed to livestock that then we eat those those meat products. So potentially moving through the food chain in that in that fashion. And then also here is just as AFFF firefighting foam, PFAS containing firefighting foam. This is commonly used on military bases and any FAA sanctioned airport, which is most of our civilian airports across the country.
So just showing the transfers, and just recall that these are not easily broken down, they don’t degrade naturally within the environment, so any of these compounds that have been manufactured they just kind of moved through the environment through these various pathways. Some statistics, virtually all of us, if we were to draw blood today we had find PFAS in our blood. Not necessarily from drinking water, but drinking water accounts for most about 20% of your PFAS exposure, 50% is coming from your food and another 20% is coming from household dust from the consumer products that surround us.
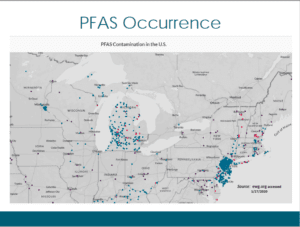
So I know here in Madison a lot of what we hear is that there’s PFAS in in our water and it’s given the impression that it’s only Madison that has PFAS in its water. This here is a map where I’m only showing the Northeast and the Midwest just to put it up here to scale that you can see. These are showing all the known contamination sites across the country they’ve been documented. There are some purple dots on here which are hard to see, those are all military installations military bases where PFAS has been detected in groundwater. The red dots correspond to other sites typically industrial manufacturers where there have been discharges which have contaminated ground and or surface water. And then all the blue dots are drinking water communities that have had PFAS detected. If you look very closely at the state of Wisconsin there are four dots. Madison, LaCrosse, Rhinelander and West Bend. Three of them, not Madison, detected PFAS in 2015 as part of an EPA requirement. Madison has tested our wells, but very few communities in the state of Wisconsin have tested their water for PFAS. If they did it in 2015 they were using higher detection limits, so they were using analytical methods that are not as sensitive as they are today. What you notice is Michigan has quite a few blue dots. Michigan required all of their public water systems to test for PFAS and that’s what’s demonstrated there. New Jersey which this looks like the outline of the state with all the blue does, probably also a pretty good sense of where population densities are within the state, but again New Jersey has required testing for all those. You can look at some other states like Pennsylvania, Iowa and some of the other states and there’s no blue dots and that’s just not not because there’s no PFAS in the water, it’s just because, likely, there hasn’t been any testing.
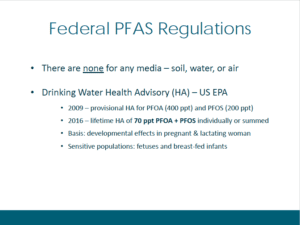
The water utility is guided by the EPA and the DNR. At the federal level there is no existing regulation for PFAS in any media, not water, not air, not soil. No regulations. The only thing that we have is a health advisory from EPA, this is a drinking water health advisory, there was a provisional advisory in 2009 it it basically said it looked at only PFOA and PFOS. PFOA said it could be 400 parts per trillion in drinking water and 200 of parts per trillion of PFOS. That was revised in 2006 (2016?) for a lifetime health advisory of 70 part per trillion for PFOA of PFOS, either the individual compound could be 70 part per trillion or sum total of PFOA plus PFOS needs to be below 70 parts per trillion. This is not a regulation, this is a non-enforceable guideline or guidance that’s provided the drinking water utilities. So it’s not enforceable.
I just like to take a second to step back, I mentioned parts per trillion. Trillion is not a number that I can easily wrap my brain around, so I try to think about that. There are 1 million, millions in a in a trillion. It’s a very it’s a very large number. Another way of thinking about this, there’s about a hundred and forty drops of water here. This is the amount of PFAS that it would take to contaminate all of Lake Wingra if we could evenly mix it to the one part per trillion level. Another way of thinking about that, that I find easier for myself, is thinking about the distance from the palm of my hand to my fingertip. This is one trillionth of the distance to the surface of the sun. So a part per trillion is a very, very small quantity. I just want to have that perspective.
So that’s that’s the federal guidance that we have. We have a guidance issue. But that’s not all that we can look to. We can look to see what others states have done.
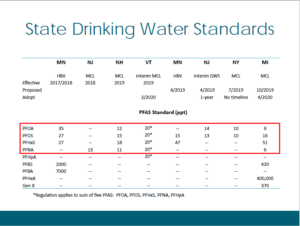
Accross the top is a number of states that have actually provided guidance or drinking water regulations for a number of these compounds. Here’s the compounds we are talking about. These for compounds PFOA, PFOS, PFHxS and PFNA are the most well studied. These are the ones we have the most information about toxicology. These are all guidance or regulations that have been passed just in the last two years. So this is not based on studies from 2005 or 2010, this is the best available science that we have. What these states have decided is that a safe level of PFOA is somewhere between 8 and 35 parts per trillion. Keep in mind this is lower than the 70 parts per trillion that EPA has said. PFOS, this is the one most of the communities are looking at. It’s somewhere between 10 and 27. You combine those and again they’re less than that 70 part per trillion. There’s there’s others that have numbers here but I just wanted to put that for reference so we can look to other states or some guidance. It’s also noteworthy that the DNR has asked the Department of Health Services (DHS) to evaluate these compounds and propose groundwater standards and so DHS has done that and has recommended that the groundwater standard which can serve as the basis for a drinking water standard for these two compounds – PFOA and PFOS should be set at twenty part per trillion, that would be in the state of Wisconsin. I also just want to draw attention to one compound in particular PFBA – this is a compound that’s noteworthy because it’s present at well 9 and maybe cause some concern. There is a health based value established by Minnesota, its the only health based value that he is aware of in the United States that’s a safe level at 7,000 parts parts per trillion. So significantly higher than these other compounds in particular PFOA and PFOS.
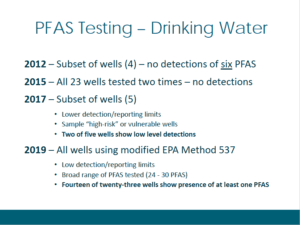
2012 – I just wanted to give a little bit of background in terms of the testing. We’ve been doing some testing for PFAS compounds here in Madison since 2012. We knew that we were going to have to test for all of our wells in 2015. We had an opportunity to to work with a lab that was trying to get accreditation for doing these tests. They offered us very low cost of testing for looking for 6 PFAS compounds, we evaluated four wells for those and we didn’t find anything.
2015 – We did an EPA required testing in 2015. We looked at all of our wells twice, we didn’t find anything. Didn’t find PFOA, didn’t find PFOS. Didn’t find any of these six compounds that we were required to test for. If you recall back in 2016 was when EPA revised their provisional health advisory and revised that downward to the existing health advisory of seventy part per trillion. There was some concern because in this testing that we had done in 2015, the detection limits were really close to what that combined level of PFOAs at seventy part per trillion. We were concerned that there could potentially be detection pf PFOA and PFOS at lower levels that we might not have seen in 2015 but they might be present and could be close to the existing health advisory.
2017 – So we went ahead in 2017, we found a lab this experimental method that looked (a non-standard method) to look at those 6 PFAS compounds at low detection limits and the detection limit was two part per trillion. In 2015 those detection limits were 20 and 40 parts per trillion. So there were significant improvements that some labs were able to attain in terms of lowering that detection limit, so we are looking at very low levels for these for these PFAS com pounds and we looked for six of them and we identified what we considered high-risk or vulnerable wells. We looked at our wells that were close to the airport and near a landfill, because airports and landfills were suspected to be potential sources for PFAS in groundwater. We did find that two of those five wells had low level detections of PFAS or if one of the six or more than one of the six. Well 15 being one of them, and well 16 on the on the west side had a detection of two part per trillion of one PFAS compound.
2019 – Then just last year again using a modified EPA method that had low detection limits that expanded the number of PFAS compounds, so instead of just looking at six that we did in 2012, 2015, and 2017, we looked at somewhere between 24 and 30 PFAS compounds because the analytics allowed us to expand that. Now these are again are not EPA standard methods, these are essentially modified methods where each lab has made some modifications to an existing test to try to tease out lower detection limits and look for a broader array of PFAS compounds. We we did that and that’s when we found it 14 of the 23 wells had at least one PFAS detected.
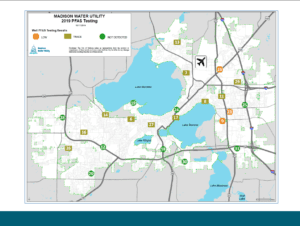
This map here is showing the City of Madison with all of the wells.
9 wells no detection– Green circles, there are 9 of them, so nine of our wells have no detection of those 24-30 PFAS compounds that we tested for.
11 wells trace detection – There are the brown boxes, there are 11 of the, those 11 wells have what they call trace detections. The total concentrations, the sum concentration of all the 24-30 PFAS compounds is less 20 part per trillion again that matches with the the the Wisconsin DHS recommendation. But remember that recommendation is just 4 PFOA, PROS and we tested for PFOA/PFOS plus 28 other PFAS compounds.
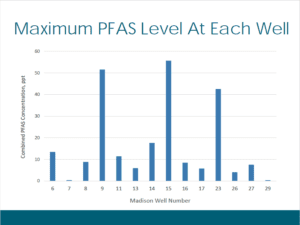
3 wells “low detection” – Well 15 up by the airport, Well 9 and Well 23 which is on the east side of Lake Mendota, those three “we say have low levels” and low levels is something that’s above 20 part per trillion.
Taking a closer look at this this is what the sum or the combined concentration of those 24 to 30 PFAS compounds. The x axis (horizontal) is the well number, on the Y axis they show the sum concentration measured in parts per trillion, ranging from 0 to 60. What we see is there’s 9, 15 and 23 – those three wells have somewhere between 40 and 55 part per trillion of this sum or combined PFAS concentration. We do have a couple, Well 6, Well 11 and Well 14 are somewhere between 10 and 20 and everything else is less than 10. You’ll note that some of them have just a fraction of one PFAS compound.
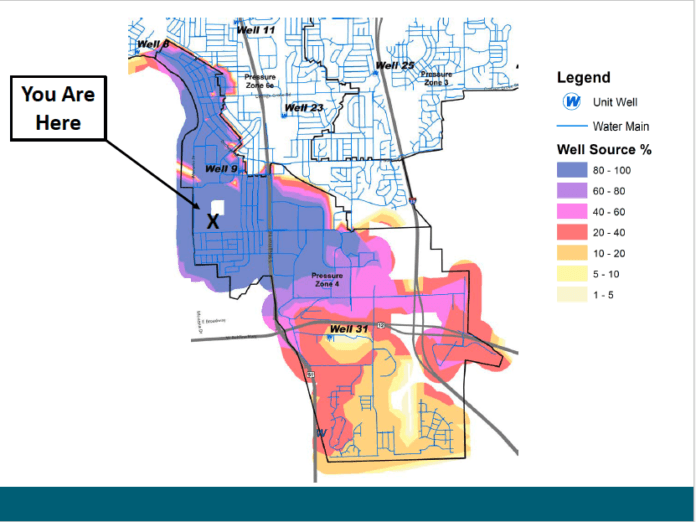
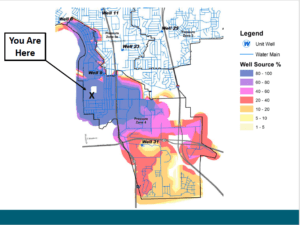
Madison water distribution system is broken up into pressure zones based on elevation. We isolate certain portions of our distribution system and it’s based on elevation because the city of Madison is a bowl, the lakes are a low point and as you move away from the center city it gets higher elevation. If you have wells or distribution system at those low points it’s hard to pump water uphill so you want to isolate those lower areas and that’s a pressure zone and the higher you move up you isolate those pressure zones to reduce your energy costs for moving the water around, This is the outline of pressure zone 4, so if you live around here you’re probably in pressure zone 4. On the north the boundary there is just east of Olbrich Park and that line up there is the bike path. Well 9 is on Sponem Ave and then we have well 31 which is down on Tradewinds Parkway just south of the Beltline. Those two wells provide water to this pressure zone. Before two years ago only well 9 provided water to this pressure zone, so we now have two wells – well 31 provides for some redundancy so if something happens to Well 9 you have another well within this zone to to provide supply in that area.
So what is this showing this is a little confusing right? You know there’s a bunch of colors. This is a heat map which is based on our hydraulic modeling showing how much water a particular location gets from Well 9. So those purple areas correspond to areas that are predominantly getting all their water from Well 9. So if you live close to well nine or basically if you live in the northern half of this pressure zone probably all of your water is coming from Well 9. The cut off here is approximately Femrite Drive which is the the blue line just below where it says pressure zone four. And then it drops off a little bit. Primarily south of Femrite Drive more of the water’s coming from Well 31. We can talk more about this when people have questions, but this is an approximation for where your water comes from and we’re right there.
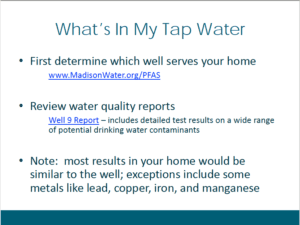
So if you’re interested in what’s in your tap water at your location, we do have an application on our website that you can punch in your address and it’ll tell you which well serves your home and approximately what percentage of water comes from each of those wells. I was planning on going to that, but the technology is really slow it might take us five minutes to get on the internet, so I’m not going to do that. But you can just punch this in madisonwater.org/pfas and on the sidebar there’s going to be a link to something that says which well serves my area. In addition to telling you what is the source of your water at that location, could be your your home, or your office or it could be where you work. In addition if you click on the well it will give you a detailed well report. Where the water primarily serves? how much water we pumped last year? what was the results of our bacteriological tests? All kinds of metals and minerals and other contaminants that are tested for, man-made contaminants, it’s all on there. We update that once a year, we’re currently in the process of assembling all of the 2019 data and we’ll be updating that in the next couple of months. But there’s lots of detail water quality information that’s available on our website.
The only thing I would say is that there are some variations it’s possible that lead levels, copper levels, iron and manganese – those are four metals that the numbers that you see of your home or the amounts that you see your home could be different from what’s report on these results namely because copper is going to be dependent on what type of pipe materials you have in your home and then the iron and manganese these are minerals that can accumulate in our distribution system and those the numbers can increase during the course of our operations. Within this pressure zone that’s not an issue.
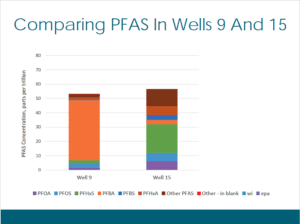
So I did want to take a couple minutes here to compare Well 9 to Well 15, because I know that there is some concern about the concentrations of PFAS at Well 9 to Well 15. They look very similar, right? So this raises alarm, I think, for some people. What is this graph here showing? On the y-axis I’m just showing the PFAS concentration measured from 0 to 80 parts per trillion and comparing Well 9 to Well 15 for these specific PFAS compounds. The ones of note, PFOA, PFOS these are the only ones the EPA has a health advisory for and they’re the ones right now that that Wisconsin is evaluating for a groundwater standard. We see at well 9, its just under 5 parts per trillion. And Well 15 its about 12 part per trillion. At well 9 we also see this big orange part of the bar. That is PFBA, that’s important because this is one of those short chain PFAS compounds where the toxicology suggests this is a less harmful PFAS compund and the only health based standard that we’ve seen out there, a guideline, it’s 7,000 there’s about 40 part per trillion here. So just for a comparison. (This wasn’t in the power point they sent, but it is in the video) I just wanted to put this that bar over there is that seventy part per trillion for the EPA health advisory which we now know is insufficient, but if we look at just the lower part that’s the State of Wisconsin. Well 15 is below that, well 9 is below that.
So if we’re using these standards why did we shut off well 15? Vermont uses that 20 part per trillion and it’s used for five PFAS compounds, including PFAxS. So at well 15 we look at PFOA, PFOS, PFHxS, the concentrations is thirty-two. Vermont would say that that water is unfit to drink. Should not be drunk. That’s a standard that we’re using, that guides our decision about well 15.
Lots of detail in here, not going to talk about this. (There was a slide they briefly showed at the presentation, but he skipped it and it wasn’t in the powerpoint that was given to me.)
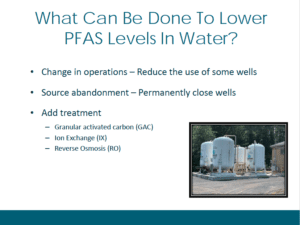
What can be done? There’s a couple of things that we can do.
Operations – One is we can change our operations. We can reduce how much we pump well Well 9. Or, for example, we can abandon the source. We can say, nope there’s too much PFAS in here, we don’t want to use this well we’re gonna shut it down. I’m told there’s people in our community, myself included, they want PFAS-free water. We’ve got PFAS in 14 wells, we can’t shut down 14 wells. We just can’t do that, we can’t provide water or fire protection to our community by shutting down all those wells. Right now it’s already a challenge just having Well 15 offline. It’s okay right now during the low demand months of November through March and April, but when we get to we start getting into the summer season it starts to get challenging to fill up our reservoirs and to maintain water quality in some areas of the city because Well 15 is out of service. So those are possibilities, those are things we could do.
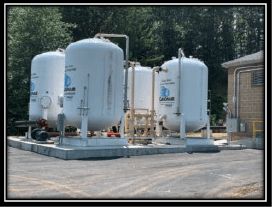
Treatment – The other is to add treatment, so activated carbon ion exchange – these are basically pressure vessels where you have a media a porous media or a flow through media inside where as the water passes through that media it grabs onto the PFAS and removes it from from the water. So essentially what you do is you have a vessel that’s accumulating the PFAS and then you have to dispose of that that PFAS containing media. Another alternative is reverse osmosis. It can also be effective where we’re using high pressure to push water push clean water through a porous membrane and leaving behind that concentrated contaminant. What happens that concentrated contaminant? Well you put it down the drain you said it’s a wastewater plant. Then what happens is the wastewater plant, well it doesn’t get taken out by the wastewater plant so your downstream neighbor now gets concentrated PFAS thanks to your operations. I mentioned that just because that’s one of the complications.
We could install something like this. That is showing four vessels at well 15 for the capacity of our well we would probably need six of those vessels. The equipment cost alone is somewhere between a half a million and a million dollars. To build a building around it, to do all the piping and all that other stuff is probably another four million dollars. So if we’re to provide treatment at well 15 that’s about a five million dollar investment. If we also wanted to do that at Well 9 – that’s another five million dollar investment. If we want to do it Well 23, that’s another five million dollar investment, at a minimum.
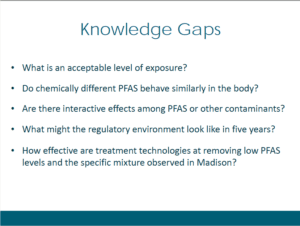
There are still a lot of these unknowns, some uncertainty here. What we don’t know is what is an acceptable level exposure, maybe are they the folks in health will talk about this. Do chemically different PFAS behave similarly in the body? These are some things that we don’t know. Are there interactive effects amongst PFAS, just amongst the different types of PFAS and or those PFAS and other contaminants that we find in water. What might the regulatory environment look like in five years? Is PFAS going to be regulated, it might not be regulated at the federal level but the state may come up with a drinking water standard and we know that they’re working on that process right now. How effective are these treatment technologies at removing PFAS and the specific mixture that we have in Madison. We need to do a pilot test to evaluate that and find the right type of media that would work and then obviously see if that’s gonna work overall within our system so there are some possibilities.
PUBLIC HEALTH DEPARTMENT PRESENTATION
Doug Voegeli is the Direct of Environmental Health for the Public Health Department for Madison and Dane County. He wants to go over some of the health impacts that we have related to PFAS.
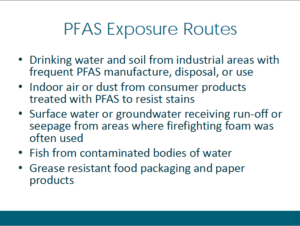
One important thing to remember is that the most the route the biggest route of exposure is ingestion, so we’re taking it into our bodies that’s the main route of exposure to PFAS from the environment. So drinking water, soil from industrial areas where PFAS is manufactured or disposed, if you’ve seen the the movie on Netflix they’ve talked about that extensively about the the people living in the industry areas that were producing PFAS were exposed to very high levels. Also also indoor air and dust when we have all the different Scotchgard and different treatments on our clothing and surfaces such as carpeting, that breaks down and gets into our household and then and creates dust and as we eat we are ingesting that dust as well.
We’ll talk about surface water in a little bit but groundwater, contaminated groundwater, is another way that we are exposed to PFAS as Joe was saying, about 20% of our exposure comes from drinking water. And I should say the drinking water is different from groundwater, but in our case here in Madison, we are drinking our groundwater. Then also another major route of exposure is eating fish from areas of surface water that had been contaminated. We get exposed by everyday food packaging that the PFAS is in the food packaging we eat the food that’s come in contact with it and then again we’re ingesting PFAS.
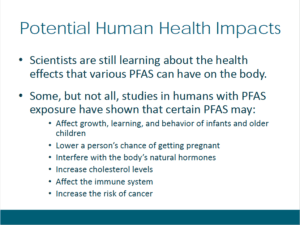
The potential human health impacts, there’s not a lot of information out there in terms of human health impacts. And the information that we do have out there is mainly based on PFOA and PFOS, so a lot of the information that we see in a lot of studies that have been done with different variables and different endpoints have been those two substances. We’re looking at probably 4,000 different PFAS substances so a lot of the health studies are based just on those two, so just to echo what Joe was just saying there’s not there’s not a lot of information on the other three thousand nine hundred and ninety eight chemicals. Just looking at these – these are the health impacts that were found. They effect the growth, learning, behavior of infants and older children, lower a person’s chance getting pregnant, interfere with some natural hormones, increased cholesterol levels, affect the immune system (they actually decrease the efficacy of vaccines) and then increase the risk of cancer.
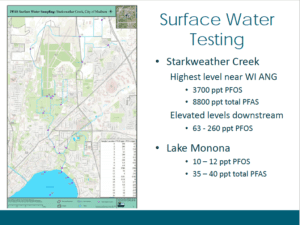
The main route of exposure is ingestion, we’re not and hopefully not we’re not drinking water directly from Starkweather Creek. The testing that has been done shows that all the levels are higher up here (by the airport) and get progressively lower as we get down into Lake Monona. But we have found PFAS in all the surface water from the airport on down into Lake Monona and in the lake as well. Again well there’s a PFAS in the surface water, we’re not drinking the surface water on a regular basis so it shouldn’t be an exposure route. However the fish are drinking the water on a regular basis and as they drink more of the water the PFAS will accumulate in the fish and then when we eat the fish we are consuming the PFAS and can experience health impacts from that.
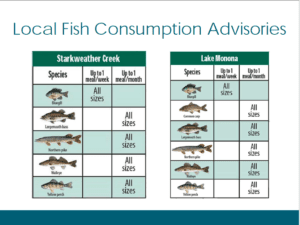
So based on the fish tissue results that were just received a couple weeks ago from the DNR they revised the fish consumption advisory for Starkweather Creek and for Lake Monona. It used to be differentiated between age, if you’re a child bearing female and male and now that’s kind of just been combined and it said the new advisory has been changed to just say one meal a week for bluegill and one meal a month for all other species. This could actually change a little bit too as additional fish tissue testing is done and it may change what species can be eaten on a regular basis because not all species have been tested yet. The DNR is planning on doing additional testing into Lake Monona, Brittingham Park and then also I believe Lake Wingra. So this is a kind of a major change and really impacts the the people that are eating fish on a regular basis or eating fish for subsistence.
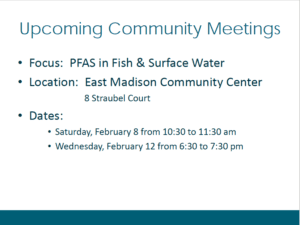
So we will be talking the Public Health Department will be talking and going into a little more depth on the surface water sampling and the fish tissue sampling at a couple community meetings we have coming up. We will be opening it up for for questions and have translation services because we really want to ensure that we are working closely with the people that are subsistence fishing to ensure that they have the correct information to make a informed decision.
Q&A
There were some good questions and comments. The first question was about “what is a fish meal” where they clearlly didn’t answer. There is also another moment where a woman expressed frustration that she wants the Water Utility to be a champion for her – picking up on the defensive and dismissive attitude of the speakers.
OTHER INFO
The Public Health Department did a a more in depth presentation at the Lakes and Watershed Commission that can be found here:
Dane County/Madison Public Health on PFAS & Fish Advisories
The County Attorney also did a presentation there on the County’s response to the DNR’s letter requiring the Air Force, County and City of Madison to investigate and clean up the contamination they are responsible for. That info can be found here:
What is the Dane County doing to clean up PFAS at the County Airport?

